Article Text

Abstract
Objectives In this study, we employ a multiomic approach to identify major cell types and subsets, and their transcriptomic profiles within the infrapatellar fat pad (IFP), and to determine differences in the IFP based on knee osteoarthritis (KOA), sex and obesity status.
Methods Single-nucleus RNA sequencing of 82 924 nuclei from 21 IFPs (n=6 healthy control and n=15 KOA donors), spatial transcriptomics and bioinformatic analyses were used to identify contributions of the IFP to KOA. We mapped cell subclusters from other white adipose tissues using publicly available literature. The diversity of fibroblasts within the IFP was investigated by bioinformatic analyses, comparing by KOA, sex and obesity status. Metabolomics was used to further explore differences in fibroblasts by obesity status.
Results We identified multiple subclusters of fibroblasts, macrophages, adipocytes and endothelial cells with unique transcriptomic profiles. Using spatial transcriptomics, we resolved distributions of cell types and their transcriptomic profiles and computationally identified putative cell–cell communication networks. Furthermore, we identified transcriptomic differences in fibroblasts from KOA versus healthy control donor IFPs, female versus male KOA-IFPs and obese versus normal body mass index (BMI) KOA-IFPs. Finally, using metabolomics, we defined differences in metabolite levels in supernatants of naïve, profibrotic stimuli-treated and proinflammatory stimuli-treated fibroblasts from obese compared to normal BMI KOA-IFPs.
Conclusions Overall, by employing a multiomic approach, this study provides the first comprehensive map of the cellular and transcriptomic diversity of human IFP and identifies IFP fibroblasts as key cells contributing to transcriptomic and metabolic differences related to KOA disease, sex or obesity.
- Osteoarthritis, Knee
- Arthritis
- Fibroblasts
- Osteoarthritis
- Risk Factors
Data availability statement
Data are available in a public, open access repository. SnRNAseq and spatial sequencing data were submitted to GEO data repository with a superseries GEO accession ID: GSE253200.
This is an open access article distributed in accordance with the Creative Commons Attribution Non Commercial (CC BY-NC 4.0) license, which permits others to distribute, remix, adapt, build upon this work non-commercially, and license their derivative works on different terms, provided the original work is properly cited, appropriate credit is given, any changes made indicated, and the use is non-commercial. See: http://creativecommons.org/licenses/by-nc/4.0/.
Statistics from Altmetric.com
WHAT IS ALREADY KNOWN ON THIS TOPIC
Previous studies suggest that the infrapatellar fat pad (IFP) is a source of tissue repair cells and contributes to knee osteoarthritis (KOA) through inflammation, fibrosis and pain; however, the exact cell composition and transcriptomic diversity of the IFP based on KOA, sex and obesity status is largely unknown.
WHAT THIS STUDY ADDS
With this study, we present a cellular and transcriptomic map of the major cell populations and their subsets within the human IFP.
We spatially locate all identified major cell types, as well as fibroblast subtypes and transcriptomic profiles.
We uncover putative cell–cell communications between fibroblasts and all other major cell types.
We compare transcriptomic profiles of IFP fibroblasts from KOA versus healthy control, female versus male KOA and obese versus normal body mass index (BMI) KOA, highlighting differences across all groups. Metabolomics uncovered potential alterations in metabolites measured from supernatants of fibroblast cultures isolated from obese compared to normal BMI KOA-IFPs.
HOW THIS STUDY MIGHT AFFECT RESEARCH, PRACTICE OR POLICY
Discovering how the IFP contributes to KOA pathogenesis in relation to OA disease, sex and obesity, we reveal potential cellular and molecular targets for future intervention that may be related to future precision medicine approaches to KOA.
Introduction
Osteoarthritis (OA) is a progressive disease that diminishes the quality of life of those afflicted. The number of cases globally has increased by 132% since 1990.1 In adults aged 45 years and older, 30% have detectable knee (K)OA, the majority being women.2 As knee osteoarthritis (KOA) progresses, severe pain and reduced mobility are primary symptoms. Primary (non-traumatic) KOA is associated with degradation of articular cartilage, chondrocyte loss and subchondral bone remodelling.3 In addition, elevated joint cytokine levels increase angiogenesis and inflammation of the synovium and fat pads.3 There is growing interest in the contribution of soft tissues to KOA pathogenesis; however, few studies have focused on understanding the infrapatellar fat pad (IFP).
The IFP is the largest fat pad within the knee, located posterior to the inferior pole of the patella, anterior to the tibia and between the anterior horns of the meniscus and femur.4 Composed of white fibrous adipose tissue, the presently known functions of the IFP are to aid with shock absorption and support the joint structure4 and may contain cells involved in tissue repair.5 However, its biological and pathological functions are not well characterised. The IFP is highly vascularised, becoming inflamed during KOA, leading to fibrosis and structural changes, potentially contributing to significant pain.6 A recent study identified some cell types in combined IFP and synovial tissue, showing that apolipoprotein from fibroblasts and macrophages imparts a cartilage-destructive effect.7 To our knowledge, no study has focused on understanding the complex diversity of the cellular composition and their transcriptomic profiles exclusively in the IFP.
Obesity [body mass index (BMI) ≥30 kg/m2] is one of the strongest risk factors for developing KOA.2 Obese individuals demonstrate chronic, low-grade, systemic inflammation and increased mechanical stress on knee joints, consequentially increasing proinflammatory adipokines and cytokines that promote KOA.8 Females are also at increased risk of KOA, and typically present with more severe pain and functional limitations compared to males.9 In a preclinical model of idiopathic KOA, removal of the IFP led to decreased cartilage degeneration within female compared to male guinea pigs.10 However, how obesity status and sex impact the IFP during KOA pathogenesis is not fully understood.
In this study, we used single-nucleus RNA sequencing (snRNA-seq), spatial transcriptomics and advanced bioinformatic methods to identify cell types and subclusters within IFPs from patient-matched samples, creating a comprehensive cell and transcriptomic map of the IFP. We determined that the IFP contains multiple cell types with specific cell subclusters, each having a unique transcriptomic profile and spatial distribution. We have performed pseudotime trajectory analysis, revealing a fibroblast population expressing universal markers that can putatively differentiate into both other fibroblast subclusters as well as adipocytes. Cell–cell communication analysis revealed putative signalling patterns across all major cell types. We demonstrated differences in the transcriptomes of fibroblasts from IFPs of KOA versus healthy control donors, females versus males with KOA and obese BMI (30–40 kg/m2) versus normal BMI (18.5–24.9 kg/m2) with KOA, suggesting putative mechanisms by which fibroblasts may contribute to KOA pathogenesis. Finally, targeted metabolomics revealed that metabolite levels in culture supernatants were modified in fibroblasts from obese compared to normal BMI KOA-IFPs and were further altered by profibrotic and proinflammatory stimuli. Overall, we provide a comprehensive map of the cellular and transcriptomic diversity of the human IFP, with considerations for KOA, sex and obesity status.
Methods
Full detailed materials and methods are available in online supplemental information.
Supplemental material
Results
Cellular composition of the IFP
IFPs from 21 study participants (6 healthy control and 15 KOA) were analysed using snRNA-seq and bioinformatic analyses to identify cell types11 (figure 1A; online supplemental figure 1,2,3A, online supplemental table 1). A total of 82 924 nuclei were sequenced and, after filtering, 73 808 nuclei were analysed. Eight cell types were identified based on canonical markers: fibroblasts, adipocytes, macrophages, endothelial cells, dendritic cells, smooth muscle cells, lymphocytes and mast cells (figure 1B–D; online supplemental figure 3A). The major cell populations contributing to the IFP (>10% of nuclei analysed) were fibroblasts (44.35%), macrophages (19.44%), adipocytes (16.41%) and endothelial cells (12.12%) (figure 1C,D).
Supplemental material
Supplemental material

Infrapatellar fat pad (IFP) cell populations and fibroblast subclusters identified by single-nucleus RNA sequencing (n=21). (A) Schematic workflow to identify cell types and subclusters within human IFPs (created with BioRender.com). (B) Uniform manifold approximation and projection (UMAP) of clusters identified in IFPs. (C) Dot plot with the average and percent population expression of canonical markers for each cell population. (D) Heatmap displaying expression of the top two differentially expressed genes (DEGs) within each cell population. (E) UMAP of fibroblast subclusters and bar plot depicting fibroblast proportion of each subcluster. Top five unique DEGs defining each subcluster are indicated. (F) Violin and density plots displaying the expression of the top two unique DEGs within each fibroblast subcluster. Density plots display expression density ranging from dark purple (low) to yellow (high). (G) Two-dimensional plot showing inferred trajectory across pseudotime of integrated fibroblast subclusters using SCORPIUS. Heatmap demonstrating the change in average scaled expression of the top 94 important genes defining fibroblast subcluster trajectory across pseudotime (q<0.05). Genes in the heatmap are clustered into four modules, each representing a set of genes expressed at different time points of the trajectory. Jitter plots depict the expression of the top marker gene for distinct subclusters across pseudotime (see online supplemental figures 2–4, online supplemental figure 6 and online supplemental table 2A).
Supplemental material
Cell subclusters and transcriptomic profiles of the IFP
We next aimed to determine cell subclusters of each major cell type identified within the IFP (n=21).11 Subclustering fibroblasts determined five subclusters, with proportions ranging from 30.32% (subcluster 0) to 9.63% (subcluster 4) (total nuclei: 32 862, resolution 0.2) (figure 1E; online supplemental figure 3B). Unique transcriptomic profiles for each fibroblast subcluster were generated by identifying differentially expressed genes (DEGs) in one subcluster as compared to others. These unique profiles ranged from 225 genes (subcluster 2) to 43 genes (subcluster 3) [q<0.05, log2 fold change (FC) ≥0.5, min.pct≥0.25] (online supplemental figure 4; online supplemental table 2A). The top five genes for each fibroblast subcluster, based on decreasing Log2FC, included subcluster 0: FBN1, PXDNL, PIEZO2, GUCY1A2 and PTGIS; subcluster 1: ABCA10, KCND2, ABCA6, ABCA8 and ABCA9; subcluster 2: CRTAC1, CLIC5, PRG4, FN1 and SEMA3A; subcluster 3: GPAM, FABP4, F13A1, FTL and FTH1 and subcluster 4: MGAT4C, GRIP1, BTBD11, IGF1 and C1GALT1 (figure 1F, online supplemental figure 3C; online supplemental table 2A). We then used flow cytometry to identify the major fibroblast subclusters at the protein level using an additional n=12 IFP samples (online supplemental figure 5A). Our flow cytometry panel included CD26/DPP4, CD10/MME/CALLA and HLA-C, cell surface proteins that we identified as key markers for the three major fibroblast subclusters, subcluster 0, subcluster 1 and subcluster 2, respectively (online supplemental figure 5B). These markers were assessed on fibroblasts (PDPN+CD45−), revealing subcluster 0 and subcluster 1 populations to be the most prevalent (online supplemental figure 5C,D), as we observed in our snRNA-seq dataset.
Next, pseudotime trajectory analysis using SCORPIUS V.1.0.912 showed a clear transition of fibroblast subclusters from subcluster 0 to subcluster 2, through subclusters 3, 1 and 4 (figure 1G). We identified genes that predicted the ordering of fibroblast subclusters along pseudotime, ranked by importance scores. There were distinct changes in module expression profiles, corresponding to transcriptomic profiles of fibroblast subclusters (figure 1G). Additionally, top markers of subcluster 0 (FBN1), subcluster 1 (ABCA10), subcluster 2 (CRTAC1) and subcluster 4 (MGAT4C) showed peak expression in respective subclusters along pseudotime (figure 1G). Fibroblasts expressing DPP4, PI16 and CD34 have previously been characterised as universal fibroblasts able to differentiate into more specialised fibroblast subtypes.13 In our dataset, these markers were highly expressed in subcluster 0, suggesting that it may act as precursors for other fibroblast subclusters we identified (figure 1G; online supplemental figure 6).
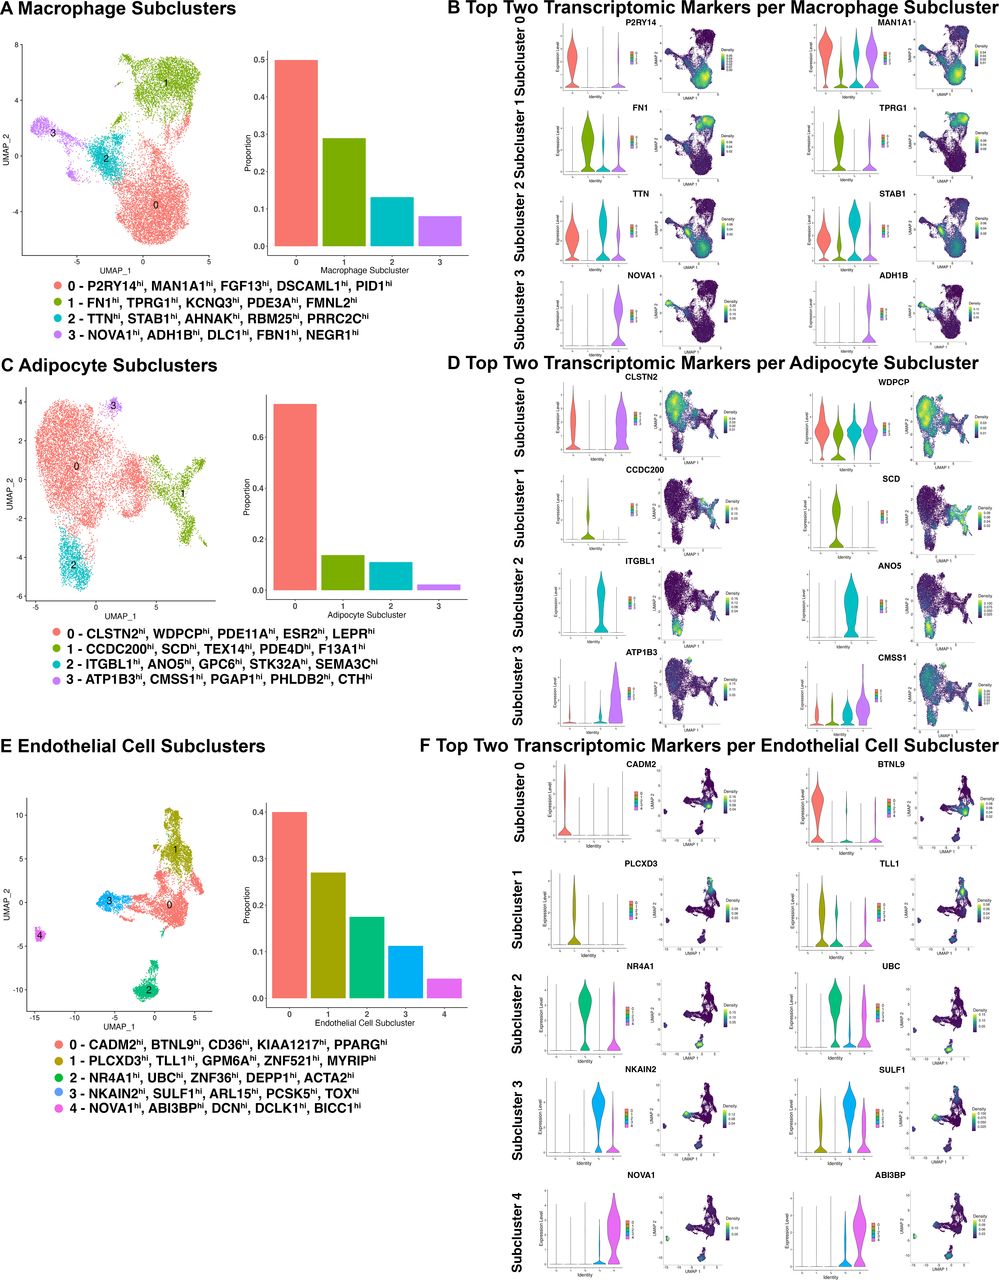
Using a similar bioinformatic strategy, we uncovered four subclusters of macrophages within the IFP, with proportions ranging from 49.85% (subcluster 0) to 8.06% (subcluster 3) (total nuclei: 14 351, resolution 0.1) (figure 2A, online supplemental figure 7A). Each macrophage subcluster had unique transcriptomic profiles spanning from 232 genes (subcluster 1) to 74 genes (subcluster 3) (online supplemental figure 8; online supplemental table 2B). The top five genes for each macrophage subcluster based on decreasing log2FC (q<0.05, Log2FC≥0.5, min.pct≥0.25), included subcluster 0: P2RY14, MAN1A1, FGF13, DSCAML1 and PID1; subcluster 1: FN1, TPRG1, KCNQ3, PDE3A and FMNL2; subcluster 2: TTN, STAB1, AHNAK, RBM25 and PRRC2C; subcluster 3: NOVA1, ADH1B, DLC1, FBN1 and NEGR1 (figure 2B; online supplemental figure 7B; online supplemental table 2B).

Macrophage, adipocyte and endothelial cell subclusters in infrapatellar fat pad identified by single-nucleus RNA sequencing (n=21). (A, C, E) UMAPs and bar plots depicting cell type subclusters and their respective proportions. Top five DEGs within each cluster are indicated. (B, D, F) Violin plots and density plots depicting the expression of the top two unique transcriptomic markers within each macrophage, adipocyte and endothelial cell subcluster. Density plots present the expression density from dark purple (low) to yellow (high) (see online supplemental figures 7–13, online supplemental table 2B–D). DEGs, differentially expressed genes; UMAP, uniform manifold approximation and projection.
Subclustering of adipocytes identified four subclusters, with proportions ranging from 72.97% (subcluster 0) to 2.25% (subcluster 3) (total nuclei: 12 111, resolution 0.08) (figure 2C; online supplemental figure 9A). All adipocyte subclusters had unique transcriptomic markers, ranging from 160 genes (subcluster 2) to 89 genes (subcluster 0) (online supplemental figure 10; online supplemental table 2C). The top five genes for each subcluster based on decreasing log2FC (q<0.05, log2FC≥0.5, min.pct≥0.25), included subcluster 0: CLSTN2, WDPCP, PDE11A, ESR2 and LEPR; subcluster 1: CCDC200, SCD, TEX14, PDE4D and F13A1; subcluster 2: ITGBL1, ANO5, GPC6, STK32A and SEMA3C; subcluster 3: ATP1B3, CMSS1, PGAP1, PHLDB2 and CTH (figure 2D; online supplemental figure 9B; online supplemental table 2C). Pseudotime trajectory analysis of both adipocytes and fibroblasts together demonstrated a bidirectional differentiation pattern. Fibroblast subcluster 0 showed the greatest expression of universal fibroblast markers DPP4, PI16 and CD34, as described within fibroblast trajectory alone (figure 1G). This fibroblast population showed a trajectory towards adipocyte subcluster 1, through subclusters 3 and 0, terminating in subcluster 2, a more differentiated adipocyte population expressing PPARG and ADIPOQ (online supplemental figure 11). Fibroblast subcluster 3 was located between fibroblast subcluster 0 and all adipocyte subclusters within the trajectory suggesting that fibroblast subcluster 3 may contain a population of preadipocyte cells which further differentiates into specialised adipocyte populations (online supplemental figure 11). Additionally, fibroblasts expressing universal markers could also differentiate into more specialised fibroblasts, as demonstrated through CD55 and PDGFRA expression (online supplemental figure 11). This suggests that more differentiated adipocytes and fibroblasts can be derived from fibroblasts that express universal fibroblast markers.
Finally, we identified five endothelial cell subclusters within the IFP, with proportions ranging from 40% (subcluster 0) to 4.22% (subcluster 4) (total nuclei: 8944, resolution 0.05) (figure 2E; online supplemental figure 12A). Each endothelial cell subcluster had unique transcriptomic markers, ranging from 225 genes (subcluster 3) to 153 genes (subcluster 0) (online supplemental figure 13; online supplemental table 2D). The top five genes for each endothelial cell subcluster based on decreasing log2FC (q<0.05, log2FC≥0.5, min.pct≥0.25), included subcluster 0: CADM2, BTNL9, CD36, KIAA1217 and PPARG; subcluster 1: PLCXD3, TLL1, GPM6A, ZNF521 and MYRIP; subcluster 2: NR4A1, UBC, ZFP36, DEPP1 and ACTA2; subcluster 3: NKAIN2, SULF1, ARL15, PCSK5 and TOX; subcluster 4: NOVA1, ABI3BP, DCN, DCLK1 and BICC1 (figure 2F; online supplemental figure 12B; online supplemental table 2D).
Using previously published datasets, we determined that fibroblast subclusters within the IFP mapped to fibroblast populations identified from other adipose tissues (online supplemental figure 14A).7 13–16 In combined IFP and synovial tissue, four fibroblast subsets were uncovered,7 consistent with that determined using IFP only in our study (online supplemental figure 14A). Fibroblasts identified can also be referred to as preadipocytes, adipocyte stem and progenitor cells and mesenchymal stromal cells as they mapped to populations using this nomenclature.7 13–16 In addition, we mapped macrophage, adipocyte and endothelial cell subclusters we identified using reported white adipose tissue markers (online supplemental figure 14 B–D).13
Spatial profiling of major cell types, fibroblast subclusters and transcriptomic profiles of the KOA-IFP
After revealing major cell types, subtypes and their transcriptomic profiles within the IFP, we sought to resolve their spatial distribution using spatial transcriptomics (figure 3A). We analysed n=12 KOA-IFPs patient-matched to tissues analysed by snRNA-seq using Visium CytAssist spatial transcriptomics17 (online supplemental table 1). Spatial data were clustered and annotated independently from snRNA-seq data. We confirmed that fibroblasts, macrophages, adipocytes and endothelial cells were the major cell populations within IFPs, with fibroblasts distributed across the IFP alongside all other major cell types (Figure 3B; online supplemental figure 15A).

Spatial profiling of major cell types identified by snRNA-seq data. (A) Schematic workflow to spatially resolve cell types within IFPs using spatial sequencing (created with BioRender.com). (B) UMAP (left) of spatial sequencing data of n=12 knee osteoarthritis (KOA)-IFP. Spatial resolution of cell populations identified using spatial sequencing across multiple IFPs (right). (C) UMAP (left) of spatial deconvolution of fibroblast subclusters across n=12 IFPs using snRNA-seq. Spatial resolution of deconvolved fibroblast subclusters within a representative IFP sample (middle). Density plots (right) displaying the module scores of the average gene expression of the top 10 transcriptomic markers of each deconvolved fibroblast subcluster. Module scores within density plots range from yellow (high) to dark purple (low). (D) Dot plots show the average expression of the top 10 transcriptomic markers within each fibroblast subcluster, from blue (low average expression) to red (high average expression). Spatial plots show the resolution of the module scores of coexpression of the top 10 transcriptomic markers of each fibroblast subcluster within a representative IFP, from blue (low module score) to yellow (high module score). (E) Spatial resolution of individual transcriptomic markers of each fibroblast subcluster include subcluster 0—FBN1 (DEG 1), subcluster 1—COL15A1 (DEG 10), subcluster 2—CRTAC1 (DEG 1), subcluster 3—FABP4 (DEG 2), subcluster 4—ENAH (DEG 5). (F) Bar plot showing the probability of each fibroblast subcluster and major cell types residing within a neighbourhood (see online supplemental figures 15,16). DEG, differentialy expressed gene; IFP, infrapatellar fat pad; snRNA-seq, single-nucleus RNA sequencing; UMAP, uniform manifold approximation and projection.
Fibroblasts from spatial transcriptomic data were deconvoluted using fibroblast subcluster annotations derived from snRNA-seq data. Each fibroblast subcluster was visualised in areas independently identified as fibroblasts by spatial transcriptomics (figure 3C). Subsequently, we spatially resolved the transcriptomic profiles of identified fibroblast subclusters through coexpression of the top 10 genes of each subcluster (figure 3D). We also visualised one of the top DEGs of each fibroblast subcluster including: subcluster 0: FBN1; subcluster 1: COL15A1; subcluster 2: CRTAC1; subcluster 3: FABP4; subcluster 4: ENAH (figure 1F; figure 3E; online supplemental figure 3C,15B).
Neighbourhood analysis using hoodscanR18 identified the probability of colocalisation of all cell types within the KOA-IFP. In five potential neighbourhoods, we found unique neighbourhoods containing all cell populations (figure 3F; online supplemental figure 16). Based on probabilities, adipocytes and endothelial cells were most likely to be found across all neighbourhoods (figure 3F). All fibroblast subclusters had a probability of being found across all neighbourhoods, with subcluster 1 likely being the dominant fibroblast subcluster within most neighbourhoods (figure 3F). Fibroblast subclusters 0 and 1 were likely the most dominant fibroblast subcluster within neighbourhood 4 (figure 3F). While we have identified five distinct neighbourhoods where all fibroblast subclusters reside, at this point, we are unable to specifically identify which anatomical features individual neighbourhoods are associated with. Overall, these data suggest that fibroblast subclusters are distributed across the IFP alongside adipocytes, endothelial cells and macrophages, with the potential to communicate.
Cell−cell communications within the KOA-IFP
Since fibroblasts had the largest proportion of nuclei, and all major cell types were spatially organised proximal to fibroblasts across IFPs, we investigated putative communications that occur between fibroblasts and all other major cell types within our snRNA-seq data. Using CellChat V.2.0,19 we identified major ligand-receptor cell signalling pathways, with macrophages, adipocytes and endothelial cells as ‘sender’ cells expressing ligands and fibroblasts as ‘receiver’ cells expressing receptors. Multiple cell communications to fibroblasts were identified, with the highest proportion of ligand-receptor pairs originating from adipocytes and the highest proportion of interactions occurring with fibroblast CD44 and ITGAV/ITGB8 receptors (figure 4A; online supplemental table 3).
Supplemental material

Putative cell–cell communication patterns between fibroblasts and major cell types. (A) Chord diagram (left) showing putative cell–cell communication between fibroblasts and other identified major cell types using snRNA-seq data from n=21 IFP samples. Fibroblasts are the ‘receiver’ cell type, expressing receptors and all other cell types are the ‘sender’ cells, expressing ligands. Individual chord diagrams (right) showing cell–cell communication between fibroblasts and other individual cell types. (B) River plot displays putative outgoing signalling patterns from each identified cell type. (C) Spatial plot showing putative collagen signalling between four major cell types along with another spatial plot displaying the expression of COL4A2-CD44 ligand-receptor pair in a representative sample. (D) Bubble plots displaying putative upregulated (left) and downregulated (right) signalling interactions between fibroblasts expressing receptors and other major cell types expressing ligands within KOA-IFPs compared to healthy control donor IFPs (see online supplemental table 3, online supplemental figures 17,18). IFP, infrapatellar fat pad; KOA, knee osteoarthritis; snRNA-seq, single nucleus RNA sequencing.
Additional investigations uncovered outgoing signalling patterns from all major cell types, without defining ‘receivers’ or ‘senders’. Regardless of directionality, fibroblasts, macrophages, adipocytes and endothelial cells had unique outgoing signalling patterns composed of multiple signalling pathways (figure 4B) suggesting intercommunication through multiple outgoing signals including collagen, PECAM1, PDGF and ANGPTL, which are known to stimulate regeneration and repair, extracellular matrix (ECM) deposition and angiogenesis.20–23
Since the collagen signalling pathway had the highest proportion of signalling going towards fibroblasts across all cell types, we spatially plotted the connectivity of this signalling network (figure 4C; online supplemental figure 17A). Furthermore, we were also able to spatially colocalise the COL4A2-CD44 ligand-receptor pair, which had one of the highest proportions of signalling within the collagen signalling pathway (figure 4A,C; online supplemental figure 17B).
We next analysed cell–cell communications within KOA-IFPs versus healthy control donor IFPs. Macrophages had a higher proportion of signalling towards fibroblasts within KOA-IFPs compared to healthy control donor IFPs (online supplemental figure 18A). Furthermore, KOA-IFPs had a higher proportion of upregulated communication interactions across all cell type pairings, compared to healthy control donor IFPs (figure 4D). The CD44 and ITGAV/ITGB8 receptors were involved in most upregulated and downregulated signals within KOA-IFPs and healthy control donor IFPs (Figure 4D). Regardless of directionality, all major cell types had some unique outgoing signalling patterns based on OA status, with a larger number of signalling interactions identified within KOA-IFPs (online supplemental figure 18B).
Transcriptomic differences in fibroblasts within the IFP based on KOA status
Since signalling to fibroblasts appeared modified in KOA-IFPs compared to healthy control donor IFPs, we investigated differences in cell composition and transcriptomic signatures based on KOA status. Fibroblasts, having the highest proportion of cells contributing to the IFP, were selected for subsequent analysis. Bioinformatic investigations of snRNA-seq data determined alterations in fibroblast subclusters within KOA-IFPs (n=15) compared to healthy control donor IFPs (n=6) (online supplemental table 1). We found all fibroblast subclusters within individual KOA-IFPs and healthy control donor IFPs (figure 5A). However, subcluster 3 had a higher proportion of nuclei contributed from healthy control donor IFPs compared to KOA-IFPs (q=0.032, multiple unpaired t-tests with false discovery rate (FDR) correction; figure 5B). Additionally, 38 DEGs (20 upregulated, 18 downregulated) were identified within KOA-IFPs versus healthy control donor IFPs, with the top five upregulated genes: FN1, ZNF385B, PRG4, ANKH and KAZN, and the top five downregulated genes: JUN, ABCA1, VIM, GSN and SAMD4A (figure 5C; online supplemental table 4A). The top five upregulated genes were highly expressed within subclusters 2 and 4 while the top five downregulated genes were highly expressed within subclusters 0, 1 and 3 (online supplemental figure 19). As downregulated and upregulated genes were localised to fibroblast clusters consistent with universal fibroblasts and the terminal fibroblast subclusters, respectively (figure 1G; online supplemental file 6), these results suggest that KOA-IFP fibroblasts have the expression profile of a more terminal differentiation state.
Supplemental material
Supplemental material

Differences in IFP fibroblast subclusters based on OA status. (A) UMAPs of fibroblast subclusters within n=21 IFPs split by disease state (n=15 KOA-IFPs, n=6 healthy control donor IFPs). UMAPs of fibroblast subclusters within each of the n=21 IFPs. 15 IFPs (top) have KOA while 6 (bottom) are healthy control donor IFPs. (B) Stacked bar plot displaying the proportion of fibroblast subclusters within KOA-IFPs compared to healthy control donor IFPs. Fibroblast subcluster 3 had significantly more nuclei contributed from healthy control donor IFPs compared to KOA-IFPs (q=0.032). Fibroblast subcluster proportions were analysed by arcsin-transformation of the absolute proportions across all samples and performing multiple unpaired t-tests with false discovery rate (FDR) correction using the Benjamini, Krieger and Yekutieli two stage step up method. Top five DEGs within each cluster are indicated. (C) Volcano plot showing the log2 fold change (FC) of DEGs in KOA-IFPs compared to healthy control donor IFPs. DEGs were defined by a minimum of 50% of nuclei expressing a marker, with a log2FC>0.5, q<0.05 are upregulated while genes with a log2FC<−0.5, q<0.05 are downregulated. (D) Enriched PathDIP pathways associated with the upregulated DEGs from KOA-IFPs compared to healthy control donor IFPs. (E) Enriched PathDIP pathways associated with the downregulated DEGs from KOA-IFPs compared to healthy control donor IFPs. (F) Interaction network showing protein–protein interactions and transcription factor-gene interactions with enriched pathDIP pathways linked to DEGs (see online supplemental table 4A-C and online supplemental figure 19). DEGs, differentially expressed gene; IFP, infrapatellar fat pad; KOA, knee osteoarthritis; UMAP, uniform manifold approximation and projection.
We next used pathDIP analysis (pathDIP V.5, https://ophid.utoronto.ca/pathDIP)24 to identify enriched pathways associated with DEGs in KOA-IFPs compared to healthy control donor IFPs (figure 5D,E; online supplemental table 4B,C). Network analysis revealed connections between DEGs and enriched pathways from KOA-IFPs versus healthy control donor-IFPs, and putative interactions between transcription factors (Figure 5F). Of note, transcription factors SOX5 and CUX1 were upregulated in KOA-IFPs compared to healthy control donor IFPs while JUN and RBPJ were downregulated, with putative interactions between JUN and CUX1, SOX5 and JUN, and RBPJ and CUX1 (figure 5C,F). This suggests that transcription factor interactions may regulate fibroblast gene expression in KOA compared to healthy IFP.
Sex-based transcriptomic differences in fibroblasts within the KOA-IFP
To understand how sex influences fibroblasts within KOA-IFPs, we performed bioinformatic analyses of snRNA-seq data of female (n=8) compared to male (n=7) KOA-IFPs (online supplemental table 1). We observed no significant differences in the presence or proportions of fibroblast subclusters (q<0.05, multiple unpaired t-tests with FDR correction; figure 6A,B; online supplemental figure 20). However, we identified differences in transcriptomic profiles of fibroblasts within female versus male KOA-IFPs (figure 6C). We determined 105 DEGs: 35 upregulated and 70 downregulated. The top five upregulated genes include CLU, HTRA1, PRG4, TMEM196 and FN1 and the top five downregulated genes include UTY, USP9Y, LAMA2, AFF3 and NAV3 (figure 6C; online supplemental table 5A).
Supplemental material

Differences in KOA-IFP fibroblast subclusters based on sex. (A) UMAPs of fibroblast subclusters within n=15 KOA-IFPs split by sex (n=8 female KOA-IFPs, n=7 male KOA-IFPs). (B) Stacked bar plot displaying the proportion of fibroblast subclusters within female KOA-IFPs compared to male KOA-IFPs. No significant differences were found in proportions of nuclei contributed to subclusters from KOA-IFPs from female versus male study participants (q<0.05). Fibroblast subcluster proportions were analysed by arcsin-transformation of the absolute proportions across all samples and performing multiple unpaired t-tests with FDR correction using the Benjamini, Krieger and Yekutieli two stage step up method. Top five DEGs within each cluster are indicated. (C) Volcano plot showing the log2 fold change (FC) of DEGs in female KOA-IFP samples compared to male KOA-IFP samples. DEGs were defined by a minimum of 50% of nuclei expressing a marker, with a log2FC>0.5, q<0.05 are upregulated while genes with a log2FC<−0.5, q<0.05 are downregulated. (D) Gene Ontology (GO) biological processes and pathDIP pathways enriched in the upregulated genes of female compared to male KOA-IFPs. (E) GO biological processes and pathDIP pathways enriched for the downregulated genes within female compared to male KOA-IFPs. (F) Interaction network showing protein–protein interactions and transcription factor–gene interactions with enriched biological processes or pathDIP pathways linked to DEGs (see online supplemental figure 20 and online supplemental file 5A-E). DEGs, differentially expressed genes; FDR, false discovery rate; KOA, knee osteoarthritis; IFP, infrapatellar fat pad; UMAP, uniform manifold approximation and projection.
We used clusterProfiler25 and pathDIP24 to perform Gene Ontology biological process and pathway enrichment analysis, identifying processes and pathways associated with DEGs of female versus male KOA-IFPs (figure 6D,E; online supplemental table 5B–E). Network analysis determined connections between DEGs and associated biological processes and pathways, with putative interactions between transcription factors (figure 6F). Notably, transcription factors SOX5, FOXP2 and CREB5 were upregulated within female versus male KOA-IFPs, while ZEB1, BCL6, ZBTB16, EBF2 and RBPJ were downregulated, with putative interactions between transcription factor pairs ZBTB16 and BCL6, and ZEB1 and BCL6 (figure 6C,F), suggesting transcriptional gene regulation by transcription factor interactions in males.
Transcriptomic differences of fibroblasts within the KOA-IFP based on obesity status
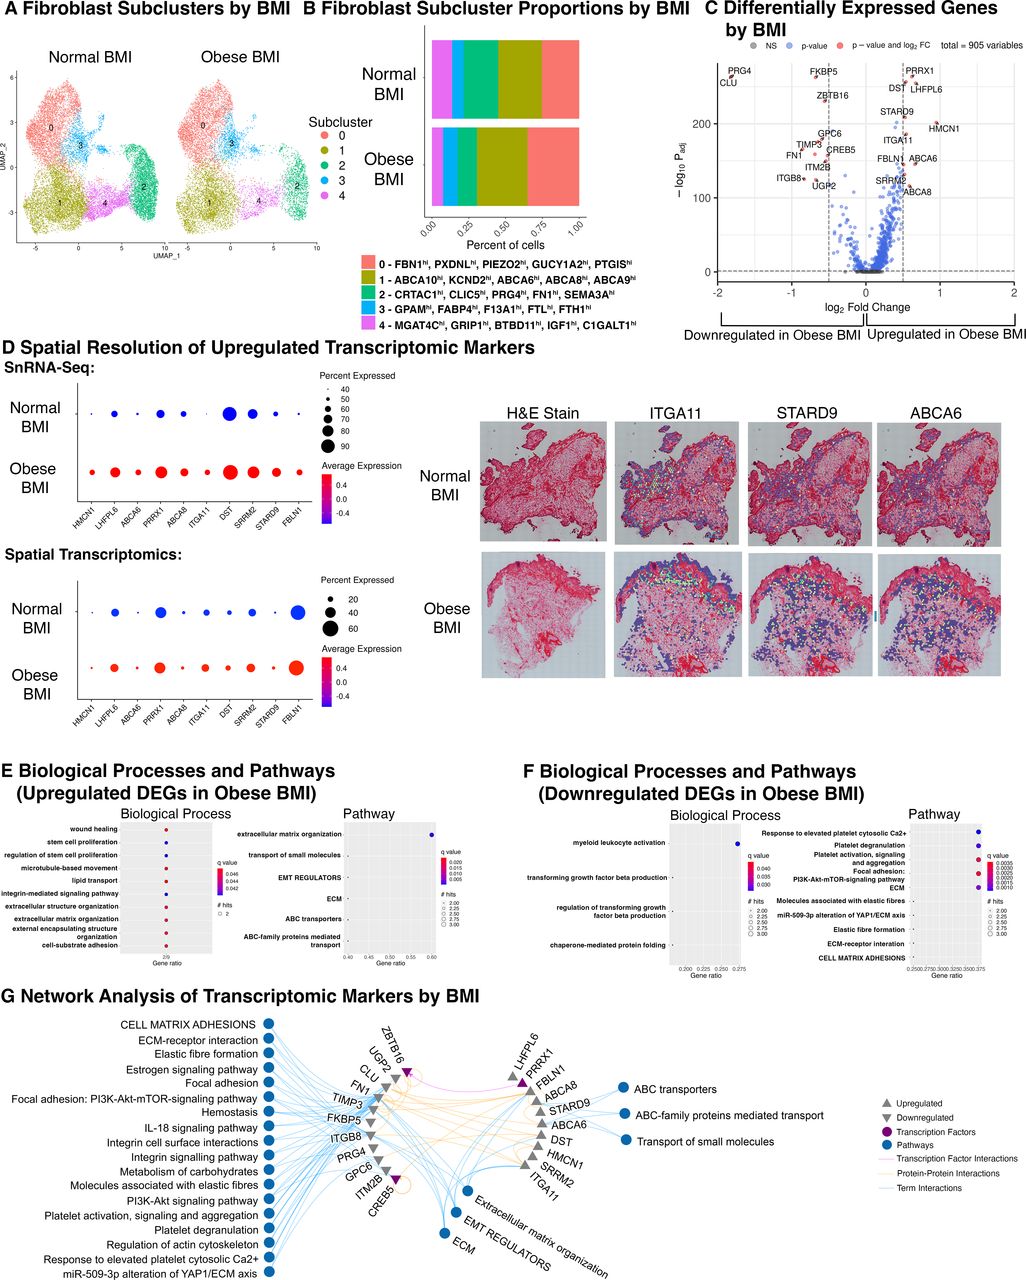
To discern how obesity status influences fibroblasts of KOA-IFPs, we performed bioinformatic analysis of snRNA-seq data comparing fibroblast subclusters within obese (n=8; BMI 30–40 kg/m2) versus normal BMI KOA-IFPs (n=7; BMI 18.5–24.9 kg/m2) (online supplemental table 1). We found no significant differences in the presence or proportions of fibroblast subclusters between normal and obese BMI KOA-IFPs (q<0.05, multiple unpaired t-tests with FDR correction) (figure 7A,B; online supplemental figure 21). However, 21 DEGs were identified; 10 upregulated, 11 downregulated (figure 7C; online supplemental table 6A). Upregulated genes from obese versus normal BMI KOA-IFPs included: HMCN1, LHFPL6, ABCA6, PRRX1, ABCA8, ITGA11, DST, STARD9, SRRM2 and FBLN1, while downregulated genes included PRG4, CLU, FN1, ITGB8, FKBP5, UGP2, TIMP3, GPC6, ZBTB16, ITM2B and CREB5 (figure 7C; online supplemental table 6A).

Differences in KOA-IFP fibroblast subclusters based on obesity status. (A) UMAPs of fibroblast subclusters within n=15 KOA-IFPs, split by obesity status (n=7 normal BMI KOA-IFPs (18.5–25 kg/m2), n=8 obese BMI KOA-IFPs (30–40 kg/m2)). (B) Stacked bar plot displaying the proportion of fibroblast subclusters within obese BMI KOA-IFPs compared to normal BMI KOA-IFPs. No significant differences were found in proportions of nuclei contributed to subclusters from KOA-IFPs from obese versus normal BMI study participants (q<0.05). Fibroblast subcluster proportions were analysed by arcsin-transformation of the absolute proportions across all samples and performing multiple unpaired t-tests with FDR correction using the Benjamini, Krieger and Yekutieli two stage step up method. Top five DEGs within each cluster are indicated. (C) Volcano plot showing the log2 fold change (FC) of genes that are uniquely differentially expressed in obese BMI compared to normal BMI KOA-IFPs. DEGs were defined by a minimum of 50% of nuclei expressing a marker, genes with a log2FC>0.5, q<0.05 are upregulated while genes with a log2FC<−0.5, q<0.05 are downregulated. (D) Dot plot (left) with average expression and percent of population expressing each DEG based on obesity status identified in snRNA-seq data (top) and within spatial sequencing data (bottom). Spatial resolution (right) of DEGs significantly upregulated within obese BMI compared to normal BMI KOA-IFPs in both snRNA-seq and spatial sequencing, visualised within spatial sequencing data. (E) GO biological processes and pathDIP pathways enriched for the upregulated genes from obese BMI compared to normal BMI KOA-IFP samples. (F) GO biological processes and pathDIP pathways enriched for downregulated genes from obese compared to normal BMI KOA-IFP samples. (G) Interaction network showing protein–protein interactions and transcription factor-gene interactions with enriched biological processes or pathDIP pathways linked to DEGs (see online supplemental figure 21, online supplemental table 6A-F). BMI, body mass index; DEGs, differentially expressed genes; ECM, extracellular matrix; FDR, false discovery rate; GO, gene ontology; KOA, knee osteoarthritis; IFP, infrapatellar fat pad; snRNA-seq, single-nucleus RNA sequencing; UMAP, uniform manifold approximation and projection.
We spatially resolved the 10 upregulated DEGs in obese compared to normal BMI KOA-IFPs using spatial transcriptomics (n=12; n=6 normal and n=6 obese BMI KOA-IFPs). All 10 upregulated genes identified in snRNA-seq data were also upregulated within spatial sequencing data based on log2FC (figure 7D; online supplemental table 6B). Interestingly, DST has a higher percent expression within snRNA-seq while FBLN1 has higher percentage expression within spatial data (figure 7D). Of the 10 upregulated genes, ITGA11, STARD9 and ABCA6 were significantly upregulated in spatial transcriptomic analyses (q<0.05; figure 7D; online supplemental table 6B).
We used clusterProfiler25 and pathDIP24 to perform Gene Ontology biological process and pathway enrichment analysis and identified enriched biological processes and pathways associated with DEGs in obese compared to normal BMI KOA-IFPs (figure 7E,F; online supplemental table 6C-F). Network analysis determined connections between DEGs and enriched biological processes and pathways, with putative interactions between transcription factors (figure 7G). Of note, the transcription factor PRRX1 was upregulated in obese versus normal BMI KOA-IFPs while ZBTB16 and CREB5 were downregulated, with a putative link between PRRX1 and ZBTB16 (figure 7C,G), suggesting transcription factor interactions may mediate transcriptional changes related to obesity status. We also identified enriched pathways related to metabolic functions, including lipid transport and carbohydrate metabolism (figure 7G).
Differences in metabolite levels of fibroblasts isolated from obese and normal BMI KOA-IFPs
Since metabolic dysregulation is a key element of obesity, and transcriptional differences in fibroblasts by obesity status had enriched pathways linked to metabolism, we sought to elucidate if alterations in supernatant metabolite levels of cultured fibroblasts from obese (n=5) compared to normal BMI KOA-IFPs (n=5) existed using targeted metabolomics (figure 8A). Overall, 445 metabolites were detected with 5 metabolites found at significantly different levels (p<0.05) from obese versus normal BMI KOA-IFPs, including upregulated: triglycerides (TG) (54:2) and TG (50:2), C18:2 (linoleic acid) and choline; downregulated: homoarginine (figure 8B; online supplemental table 7A). Using pathDIP,24 we found that differentially secreted metabolites from KOA-IFP fibroblasts by obesity status were annotated to metabolism-related pathways, including lipid metabolism, with enriched pathways associated with molecular transport (figure 8E; online supplemental figure 22).
Supplemental material

Differences in metabolite secretome in fibroblasts from KOA-IFPs based on obesity status. (A) Schematic workflow to identify differences in the metabolite levels within supernatants of fibroblast cultures of obese compared to normal BMI KOA-IFPs, stimulated with or without profibrotic or proinflammatory stimulus (created with BioRender.com). (B) Violin plot (left) and bar plot (right) showing the log2 fold change (FC) of metabolites differentially found in supernatants of fibroblast cultures from obese compared to normal BMI KOA-IFPs. Positive log2FC indicates an increase in the metabolite level within supernatants of cultures from obese compared to normal BMI KOA-IFP fibroblasts. (C) Volcano plot (left) showing the change in log2FC of metabolites differentially found in supernatants of obese compared to normal BMI KOA-IFP fibroblast cultures when treated with TGF-β compared to vehicle control. Positive values indicate a greater upregulation of metabolite level in obese versus normal BMI KOA-IFP fibroblast culture supernatants when treated with TGF-β versus vehicle control. Bar plot (right) showing the log2FC of metabolites differentially found in supernatants of obese compared to normal BMI KOA-IFP fibroblast cultures when treated with TGF-β compared to vehicle control, with positive values indicating an upregulation in levels found in supernatant. (D) Volcano plot (left) showing the change in Log2FC of metabolites differentially found in supernatants of obese compared to normal BMI KOA-IFP fibroblast cultures when treated with TNF-α compared to vehicle control. Positive values indicate a greater upregulation of a metabolite level in obese versus normal BMI KOA-IFP fibroblast culture supernatants when treated with TNF-α versus vehicle control. Bar plot (right) showing the log2FC of metabolites differentially found in supernatants of obese compared to normal BMI KOA-IFP fibroblast cultures treated with TNF-α compared to vehicle control, with positive values indicating an upregulation in secretion. Please refer to C for the legend. (E) Dot plot displaying pathways enriched for the differentially secreted metabolites by fibroblasts from obese compared to normal BMI KOA-IFPs and after treated with TGF-β versus vehicle control or TNF-α versus vehicle control (see online supplemental figure 22, online supplemental table 7A-C). BMI, body mass index; KOA, knee osteoarthritis; IFP, infrapatellar fat pad; TG, triglycerides; TGF-β, transforming growth factor β; TNF-α, tumour necrosis factor α.
Transforming growth factor β (TGF-β) can be found within KOA synovial fluid and is a key mediator involved in fibroblast activation and joint fibrosis.26 27 Furthermore, tumour necrosis factor α (TNF-α) is also found in KOA synovial fluid and is involved in promoting inflammatory responses in synovial fibroblasts.28 29 To mimic the fibrotic and inflammatory response in IFP fibroblasts, we stimulated cells with TGF-β or TNF-α, respectively. We then investigated how metabolite levels in culture supernatants of obese versus normal BMI KOA-IFP fibroblasts were modified when stimulated by TGF-β or TNF-α, compared to stimulation by vehicle control (phosphate-buffered saline). When comparing fibroblast cultures from obese versus normal BMI KOA-IFPs, nine metabolites were significantly differentially detected (p<0.05) in response to TGF-β treatment, compared to vehicle control (figure 8C; online supplemental table 7B). Mean levels of homocitrulline, ethanolamine, C16:1OH (2-hydroxypalmitoleylcarnitine), TG (52:5) and Hex2Cer (34:1) (di-hexosyl ceramide) were increased by TGF-β-treated fibroblasts from obese BMI KOA-IFPs versus vehicle control and decreased in normal BMI KOA-IFPs. In contrast, mean levels of cholesteryl esters (17:0) and (20:1), alpha-ketoglutaric acid and phosphatidylcholine diacyl (PCaa) C26:0 were increased in TGF-β-treated fibroblast cultures from normal BMI KOA-IFPs and decreased in obese BMI KOA-IFPs (figure 8C; online supplemental table 7B). Pathway enrichment analysis identified enriched metabolism and neuron-related pathways associated with the differentially secreted metabolite signature by BMI after profibrotic TGF-β stimulation (figure 8E).
Additionally, when comparing fibroblast cultures from obese versus normal BMI KOA-IFPs treated with TNF-α, levels of 10 metabolites were significantly differentially detected (p<0.05) compared to vehicle control (figure 8D; online supplemental table 7C). Mean levels of serotonin, 3-hydroxybutyric acid, 3-hydroxyisobutyric acid, glutaric acid, TGs (54:7) and (52:5) and N-acetyl-glycine were increased in TNF-α-treated fibroblast cultures from obese BMI KOA-IFPs and decreased in normal BMI KOA-IFPs (figure 8D; online supplemental table 7C). In contrast, mean levels of sphingomyelins C24:0, C16:0 and C16:1 were increased in TNF-α-treated normal BMI KOA-IFPs and decreased in obese BMI KOA-IFPs (figure 8D; online supplemental table 7C). Pathway enrichment analysis identified a single enriched pathway, cAMP signalling, associated with the differentially secreted metabolite signature from fibroblasts by obesity status with proinflammatory TNF-α stimulation (figure 8E). Overall, these data show differential metabolite levels in supernatants of fibroblasts from obese compared to normal BMI KOA-IFPs under normal conditions and in response to profibrotic and proinflammatory stimuli, with enrichment for metabolism and/or neuronal-related pathways.
Discussion
Here, we generated a transcriptomic map of the IFP, identifying and spatially resolving major cell types and subtypes using snRNA-seq, spatial transcriptomics and advanced bioinformatic analyses. We revealed that each cell type subcluster had a unique transcriptomic profile. Furthermore, we identified transcriptomic differences within IFP fibroblasts based on KOA, sex and obesity status, and metabolic alterations based on obesity status. To our knowledge, our study is the first comprehensive, tissue-specific, patient-matched transcriptomic map of the IFP, including transcriptomic analyses for KOA, sex and obesity status and using spatial transcriptomics to localise major cell populations, subclusters and transcriptomic profiles.
Similar fibroblast populations have been previously identified. A recent study investigated combined synovium and IFP tissues, identifying four fibroblast subclusters,7 in line with those we identified within IFP only. Additionally, when comparing subclusters of macrophages, adipocytes and endothelial cells identified in the IFP within our study, similar populations have been observed in other adipose tissue sources.13 Thus, it is likely that the IFP is another white adipose depot with similar composition to those previously described.
Within combined synovium and IFP analysis of mouse models, in silico analyses and lineage tracing have established that DPP4+/PI16+fibroblast cells can differentiate into mature fibroblasts of the synovium and adipocytes within the IFP.30–32 Additionally, trajectory analysis of both human synovium and IFP suggests that DPP4+cells can differentiate into adipocytes of the IFP and mature fibroblasts of the synovium.7 Our trajectory analysis also defined that IFP fibroblasts expressing universal markers (DPP4+PI16+CD34+) are likely precursors for other fibroblast subclusters and adipocytes, suggesting that fibroblasts residing in the IFP have the capacity to promote IFP-related OA pathologies through differentiation.
By employing CellChat, we determined putative communications between major cell types identified within the IFP. CD44 and ITGAV/IGTB8 receptors on fibroblasts had the highest proportion of communications with other major cell types, with this signalling retained when comparing KOA-IFPs to healthy donor control IFPs. Interestingly, CD44 binds fibronectin and collagen while ITGAV/ITGB8 binds fibronectin.33 34 We found that fibronectin ligands were expressed by macrophages and endothelial cells, while all major cell types were involved in the collagen signalling pathway (figure 4A,C). This may indicate an overexpression of collagen and fibronectin as ligands from macrophages, adipocytes and endothelial cells resulting in modification of fibroblast activity through CD44 and integrins.
After establishing transcriptomic profiles of fibroblast subclusters, we revealed transcriptomic differences based on KOA, sex and obesity status, with some DEGs being important transcription factors related to fibrosis, cell proliferation, differentiation, senescence, inflammation and ECM composition, mechanisms typically associated with joint homeostasis or KOA pathogenesis.35–47 Interestingly, some upregulated and downregulated transcription factors were found to putatively interact, a regulatory mechanism likely influencing gene expression based on KOA, sex or obesity status. Of note, the transcription factor CREB5 directly regulates the expression of lubricin, important for joint lubrication and encoded by PRG4.40 In female versus male KOA-IFPs, CREB5 was upregulated, as was PRG4, suggesting that lubrication mechanisms in fibroblasts may be enhanced in females. In obese versus normal BMI KOA-IFPs, CREB5 and PRG4 were downregulated, suggesting that joint lubricating mechanisms by IFP fibroblasts may be reduced in obese OA individuals. When comparing KOA-IFPs versus healthy control donor IFPs, DEG-associated enriched pathways were related to cell adhesion and signalling pathways, indicating that these pathways may be linked to KOA-related functions of fibroblasts. Additionally, our data showed DEG-associated enrichment for biological processes and pathways related to ECM, connective tissue and metabolism-associated processes when comparing KOA-IFPs by sex and obesity status, suggesting that these pathways may be differentially regulated in females versus males and obese BMI versus normal BMI KOA-IFPs, which requires further investigation. Overall, KOA, sex and obesity status likely impact gene expression in fibroblasts, in part through modifications of transcription factor expression, impacting overall joint biology.
While investigating DEGs of fibroblasts from obese compared to normal BMI KOA-IFPs, metabolism-related pathways were enriched (figure 7G). Differentially secreted metabolites identified from fibroblasts based on obesity status have been linked to various cellular and physiological mechanisms including lipid transport, metabolism, inflammation and pain.48–51 Additionally, metabolite level changes in response to profibrotic and proinflammatory stimuli, and associated enriched pathways, indicate that fibroblasts from obese BMI KOA-IFPs may promote inflammation, fibrosis, pain and dysregulated metabolism, as compared to fibroblasts from normal BMI KOA-IFPs, based on previously published reports.52–59 Further investigations to identify differences in the functions of fibroblasts and other major KOA-IFP cell types in KOA pathogenesis based on obesity status should be considered.
One limitation of this study may be that we analysed IFPs from n=21 study participants, which could be considered a small sample size. However, given the current literature available, the multiomic technologies used and the total number of nuclei sequenced, our sample size is large in context. It is also notable that age and BMI groups were not significantly associated in our dataset, nor were sex and BMI, suggesting unlikely confounding effects of age and sex on our results (online supplemental table 1). Since the age range of the study participants in our KOA cohort for snRNA-seq is relatively small, ranging from 50 to 64, analysing the impact of age on the KOA-IFP was not feasible in the current study. However, future studies should be directed towards understanding how age impacts the transcriptomic and cellular diversity of the IFP during KOA. Considering the IFP is a highly innervated tissue, it was surprising that we did not identify Schwann cells in our sequencing dataset. Thus, future studies should use alternative methods to attempt to identify these cells and the contribution of neuronal populations to the IFP. While this study used flow cytometry to identify cell surface markers associated with the major fibroblast subclusters (0, 1 and 2), future studies should focus on the detection of the other fibroblast subclusters and additional major cell types within the IFP tissue, which was beyond the scope of the current study. Furthermore, future investigations should also focus on understanding the transcriptomic differences of other major cell types, including macrophages, adipocytes and endothelial cells, within the IFP, with consideration for sex and obesity status.
This study has used snRNA-seq, spatial transcriptomics and advanced bioinformatic approaches to generate comprehensive transcriptomic and spatial profiles of the human IFP. By applying these high throughput methods, we identified unique transcriptomic profiles of major cell populations and subtypes present within the IFP, including fibroblasts, macrophages, adipocytes and endothelial cells. We identified fibroblasts expressing universal markers that may contribute to both other fibroblast populations and differentiated adipocytes. We revealed putative cell–cell communications between fibroblasts and all other major cell types within the IFP and based on OA status. Furthermore, we identified transcriptomic differences within fibroblasts of the IFP based on OA, sex and obesity status, and metabolic alterations based on obesity status using metabolomics. Thus, our data suggest that IFP fibroblasts are likely major contributors to IFP biology and play a role in OA pathology through transcriptional, metabolic and cell differentiation mechanisms influenced, in part, by KOA, sex and obesity status. Overall, this study provides a comprehensive map of the cellular and transcriptomic diversity of the human IFP using a multiomic approach.
Supplemental material
Data availability statement
Data are available in a public, open access repository. SnRNAseq and spatial sequencing data were submitted to GEO data repository with a superseries GEO accession ID: GSE253200.
Ethics statements
Patient consent for publication
Ethics approval
This study involves human participants and was approved by University Health Network Research Ethics Board: REB #07-0383, #14-7592, #21987. Participants gave informed consent to participate in the study before taking part.
Acknowledgments
This work is supported by the Arthritis Society of Canada Strategic Operating Grant (23-0000000271), Canada Research Chairs Program (CRC# 1019359), Tony and Shari Fell Platinum Chair in Arthritis Research (University Health Network Foundation, University Health Network, Toronto). IJ was supported in part by funding from Natural Sciences Research Council (NSERC #203475), Canada Foundation for Innovation (CFI #225404, #30865), and Ontario Research Fund (RDI #34876, RE010-020). Thank you to the Schroeder Arthritis Institute Orthopaedic Research Team for consenting and collecting study participant data. We thank Edwin Speck from Princess Margaret Flow Cytometry (https://pmflow.ca), University Health Network for their assistance in FACS cell sorting. Thank you to Melanie Peralta from the Pathology Research Program within University Health Network’s Laboratory Medicine Program–Pathology Department for their assistance with the OCT-embedded samples. We would also like to thank Farzaneh Aboualizadeh from the Princess Margaret Genomics Center, University Health Network, for their assistance with spatial sequencing within this study.
References
Supplementary materials
Supplementary Data
This web only file has been produced by the BMJ Publishing Group from an electronic file supplied by the author(s) and has not been edited for content.
Footnotes
Handling editor Josef S Smolen
Correction notice This article has been corrected since it published Online First. Figures have been replaced for clarity.
Contributors HP contributed to study design, selection study participants for IFP samples, acquisition of data, interpreting of all analyses, fibroblast culture experiments and writing of the manuscript and generation of figures. PP contributed to the analysis and interpretation of single-nucleus RNA sequencing data, CellChat analysis and generation of associated figures. JSR contributed to the analysis and interpretation of all experiments and the acquisition of funding for this study. TT contributed to the analysis and interpretation of spatial sequencing data and generation of associated figures. CP and IJ contributed to all GO biological process and pathway enrichment analysis, protein interaction and TF-target networks, and generation of associated figures. KDS contributed to tissue preparations and the completion of single-nuclei RNA sequencing experiments and data analysis. SV has contributed to the analysis pipeline used for single-nucleus RNA sequencing data, the completion of trajectory analysis and generation of associated figures. NF contributed to the completion of flow cytometry, cell experiments and data analysis. SL contributed to study design and the experimental pipeline used for single-nucleus RNA sequencing. KP contributed to the acquisition and storage of all KOA-IFP samples and clinical data through the Schroeder Arthritis Institute Orthopaedics Biobank. NL, SHL and VC contributed to the completion of all targeted metabolomics experiments. KH contributed to the analysis and interpretation of all targeted metabolomics experiments and generation of associated figures. PK contributed to fibroblast culture experiments. AVP and RR contributed to collection and interpretation of data from LEAP OA clinical database. NNM and KS contributed to the collection of KOA-IFP samples and data collection. EG contributed to data interpretation. RK contributed to the collection of healthy control donor IFP samples and data analysis. MBB contributed to the study planning and interpretation of cell population mapping using previously published literature. RG contributed to the conception and acquisition of funding for this study, the acquisition of KOA-IFPs, and interpretation of the data. MK designed the original study design, contributed to the conception and acquisition of funding for this study, directed the entire study and was involved in the interpretation of all experiments. All authors have contributed significantly to the critical revision of the manuscript and approved the final version of the manuscript. MK is the author responsible for the overall content as the guarantor.
Funding This study was funded by the Arthritis Society of Canada Strategic Operating Grant (23-0000000271), Canada Research Chairs Program (CRC#1019359), Tony and Shari Fell Platinum Chair in Arthritis Research (University Health Network Foundation, University Health Network, Toronto) (N/A), Canada Foundation for Innovation (225404, 30865), Natural Sciences Research Council (203475) and Ontario Research Fund (34876, RE010-020).
Competing interests None declared.
Patient and public involvement Patients and/or the public were not involved in the design, or conduct, or reporting, or dissemination plans of this research.
Provenance and peer review Not commissioned; externally peer reviewed.
Supplemental material This content has been supplied by the author(s). It has not been vetted by BMJ Publishing Group Limited (BMJ) and may not have been peer-reviewed. Any opinions or recommendations discussed are solely those of the author(s) and are not endorsed by BMJ. BMJ disclaims all liability and responsibility arising from any reliance placed on the content. Where the content includes any translated material, BMJ does not warrant the accuracy and reliability of the translations (including but not limited to local regulations, clinical guidelines, terminology, drug names and drug dosages), and is not responsible for any error and/or omissions arising from translation and adaptation or otherwise.